A number of changes have been made this past month to improve the performance of the ALERT Map and timeliness of the XML files that are used by other real-time applications.
A second NovaStar-5 server is now fully operational. This backup server mirrors the primary server database at Diamond Hill, is remotely located, and will failover automatically should the primary server become disabled. The backup unit also permits load sharing of data processing task. This means that XML files accessible from cloud services can be updated more frequently. Currently all rainfall, water level and weather data files are updated every minute.
The ALERT Map is one application that benefits from the dual-server implementation. Users should note more reliable automatic 1-minute data refresh rates.
Other changes to the ALERT Map include:
NWS warning area polygons are turned on by default and provide one-click access to the corresponding NWS warning product. Just click on the icon attached to the polygon to read the NWS warning.
WDT looped Radar images are turned on by default reflecting the last hour of activity. All Radar images have their opacity set for 50%, allowing users to easily see the base map. All gaging station readouts overlay on top of the Radar images.
Color coding is applied to all ALERT stage and discharge readouts to reflect threat conditions. The colors correspond to NWS AHPS threat levels with the exception of the blue readout, which represents bankfull conditions.
USGS and DWR streamgage readouts are displayed on the stage and discharge maps using darker green backgrounds to distinguish their data from the ALERT data. Links to corresponding webpages supported by the USGS and Colorado DWR can be found by clicking on the readout.
Time series plots and links to tabular data are available for all ALERT readouts including measured water levels, discharge estimates and rainfall.
We hope you find these improvements useful. As always, your comments and suggestions are welcome.
Some Google Chrome users have experienced problems with the ALERT Map webpage updating automatically. To fix this we recommend the following:
Make sure you are running the latest version of Chrome, v.35.
To re-load the page try hitting the F5 key.
This YouTube video shows how to enable auto updates for the Google Chrome browser. If your IT department has disabled the auto update feature…this can turn it back on.
We have migrated our alert5.udfcd.org URL to a new homepage. This site contains many of the same features available on the previous ‘alert5’ website. We believe you will find this new page much easier to use, especially those of you who have smartphones, tablets and iPads. For those who prefer the previous website, convenient links are provided for accessing the old alert5 webpage.
We have created a snowpack webpage for our new handheld-friendly ALERT System website that contains links to a few of my favorite pages. We hope you find this useful. Let us know if you have other favorites that you would like us to include.
[Fraug 5/16/2014] Monitoring streamflow and water levels
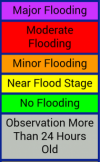
We recently updated a number of ALERT webpages with AHPS features. AHPS is a NWS acronym that stands for Advanced Hydrologic Prediction Service. See http://water.weather.gov/ahps2/index.php?wfo=bou for more information about AHPS. The legend provided was acquired from the NWS AHPS website. The yellow “Near Flood Stage” is also commonly referred to as the “Action Stage.”
Our AHPS-like ALERT webpages use the same AHPS reference levels. These levels are used by NWS as guidance for issuing flood advisories and warnings. Three UDFCD webpages that currently employ this feature are:
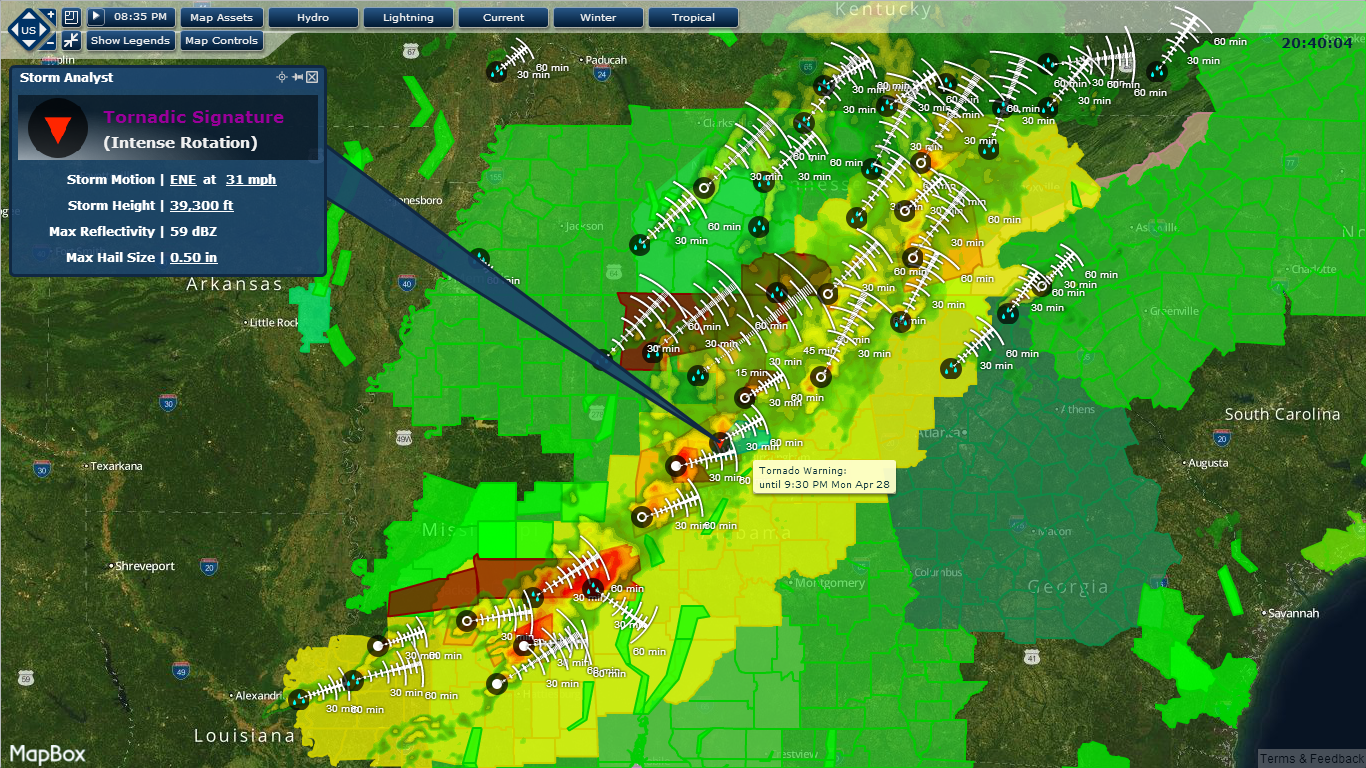
Given the magnitude of the recent severe weather outbreak, I thought you might like to see a screengrab that I captured last night from our custom WDT HydroWatch webpage.
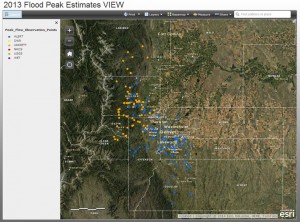
[Fraug 4/28/2014] September 2013 Peak Flow Estimates
We are putting together a webmap tool to view peak flow estimates from the floods of last September. Thought you all might be interested in this. Your comments are always welcome. This is a work in progress.
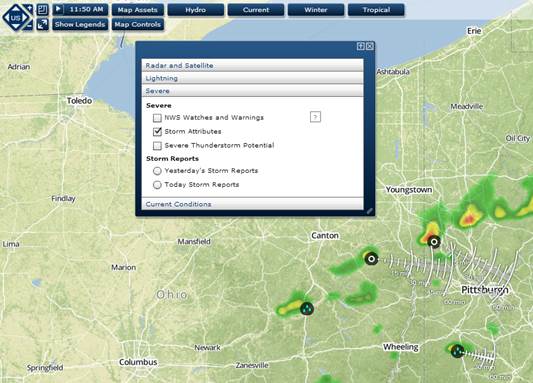
We made a couple of minor changes to this custom radar website:
The radar image default setting is now 50% transparent. To change this use the [Map Controls] button and slider.
The Storm Attributes default setting is now ON. To change this use the [Current] button, select “Severe” and uncheck the Storm Attributes box. The directional pulse shows where storms are expected to move over the next hour. If you do not see a pulse, try turning the Storm Attributes off, then on again.
The images above are current so I had to find some locations outside the District to demonstrate these features.
The website link can be found at https://alert5.udfcd.org. We recommend that you bookmark this URL as a good starting point to get to all the webpages supported by UDFCD’s F2P2.
Let me know if you would like training concerning this site. Please use my email address kstewart@udfcd.org. If you have comments that you want the entire list of subscribers to read, just send a reply to this email.
This is the first official use of this new service. There may be a few bugs to work out.
 A number of changes have been made this past month to improve the performance of the ALERT Map and timeliness of the XML files that are used by other real-time applications.