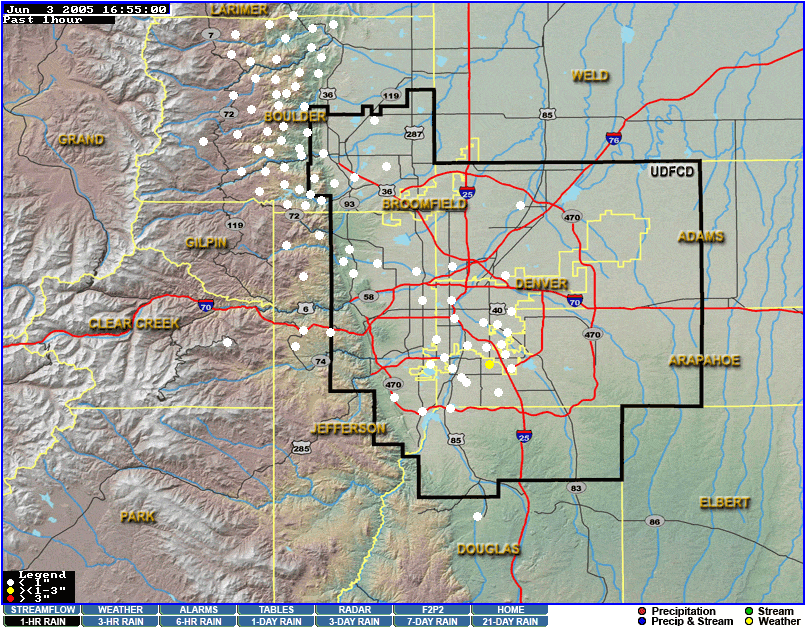
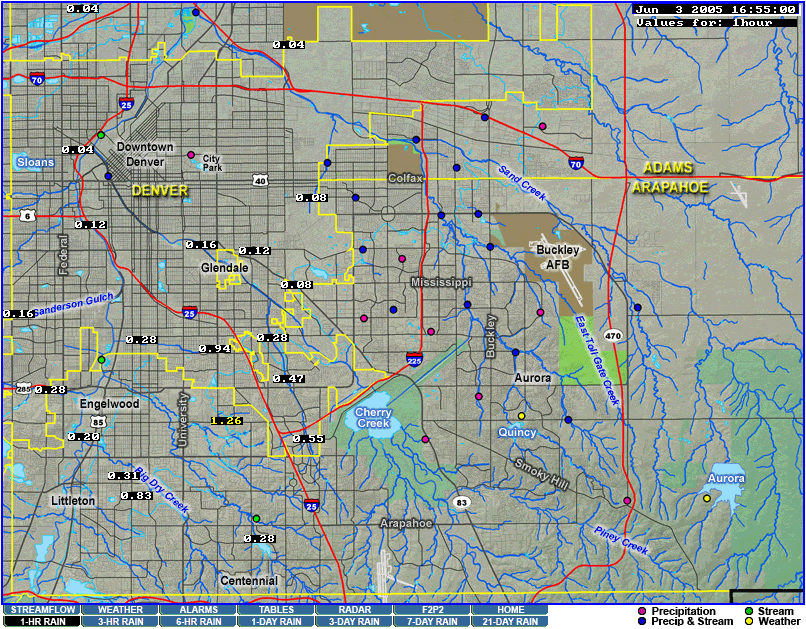
The map illustrates the utility of the updated ALERT web server for the June 3, 2005 storm. This is the default display when a user requests a map. Although no rainfall amounts are shown, it does provide a clear snapshot of current 1-hour rainfall activity for the entire ALERT network. The map automatically updates every five minutes if no browser activity is sensed. The map includes a shaded relief topography map, county boundaries, major highways, major streams and water bodies and the District boundary as background features to assist with data assessment. White dots indicate rainfall activity with less than one inch in the last hour. Yellow dots highlight rainfall activity of greater than one inch but less than three inches in the last hour and red dots warn of rainfall greater than three inches for the same 1-hour time period. Tabs along the bottom of the map provide a dashboard of options for accessing critical information regarding weather-related threats.
At 4:55pm, the yellow dot near I-25 and Hampden indicates that localized flooding may be occurring that deserves a closer look. The user can click on the map where the highlighted dot is located and the browser will display a more detailed map showing the location of the gage with the total rainfall amount measured for the past hour.
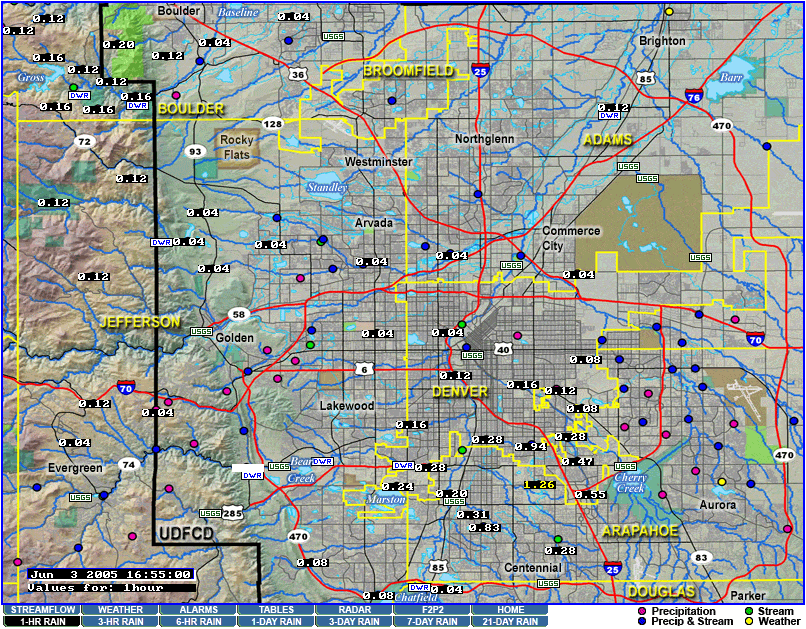
Figure 2 illustrates a more detailed map that is created by clicking, or drilling-down, on the area of the highlighted dot. The new map shows that gage 620 at Quincy and Highline (displayed by hovering the mouse over the gage readout) has received 1.26” of rainfall in the hour preceding 4:55pm.
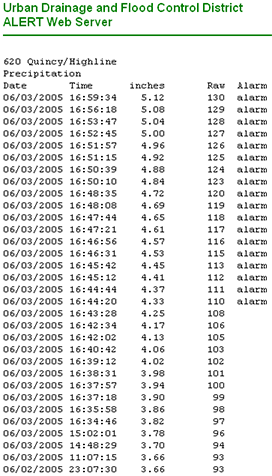 |
Clicking on the 1.26” data readout associated with gage 620 will launch a separate browser window with a table of the last 100 data reports for the gage. The data table lists date/time of the bucket tip along with corresponding cumulative precipitation totals since the sensor was last reset, not daily or storm total accumulation. The table also lists a "raw" data value that reveals missing bucket tips (see 16:48:35 to 16:50:10) and a column that indicates when alarm thresholds are exceeded. Alarm status was triggered at 4:44 on this gage because the sensor indicated that over a half-inch of rain had fall in under ten minutes. The other alarm trigger is an inch of rain in one hour. |
All of the maps include browser navigation that allow you to quickly drill-down to more detailed maps or move to adjacent maps. The streamflow maps function very similar to rainfall maps. The District’s Flood Warning staff encourage all local agencies to use the website to develop a level of comfort with the tools that are available.
Another enhancement at the District that internet users will notice immediately is the switch from an ISDN modem connection to a broadband connection. The bandwidth allocated to the ALERT web server was upgraded at the end of November and it should provide much improved performance for browsing the ALERT system interface.
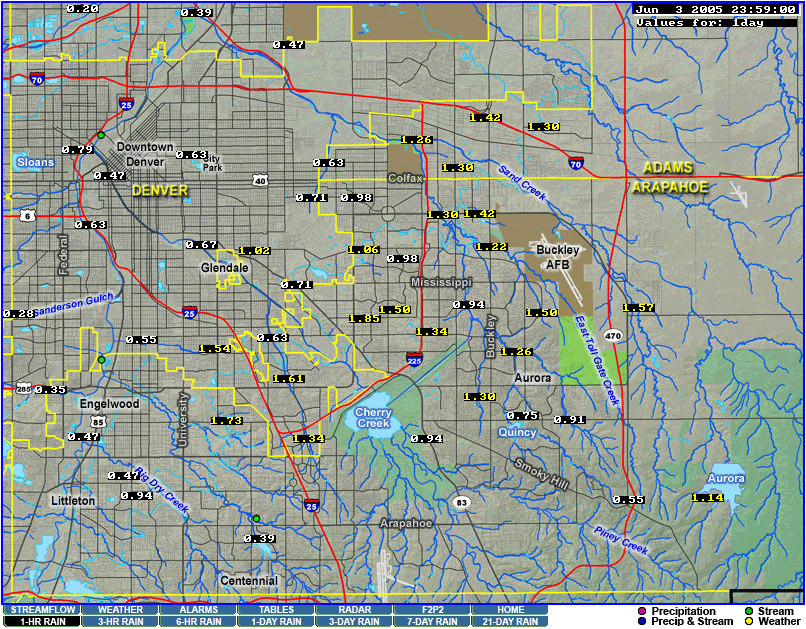
The storm total map, Figure 4, for June 3 demonstrates that the ALERT system interface is a valuable tool for assessing flood threat. The system went into alarm status at 4:44pm, before the storm moved into the east metro area and created significant traffic problems along the I-225 corridor and other parts of the area.
The final map shows the storm total precipitation for June 3, 2005.